Head Crowd Project
Original Project Brief
 Crowds: Visual Co-design via Rich Crowd-sourcing
Britta Kalkreuter(T&D) Mark Timmins(T&D) Mike Chantler(MACS)
Research student: D.Robb
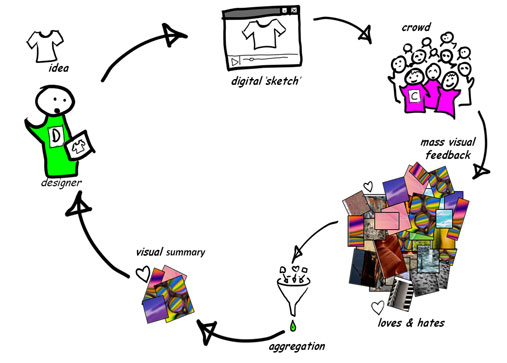
This project seeks to use rich web and mobile applications to provide designers with near instantaneous highly visual feedback from thousands of potential customers.
Such a scheme will revolutionise design and market intelligence processes by enabling rapid, inspirational and iterated co-design cycles between crowds and designers. It will:
- enable crowds to provide emotive feedback in a visual language;
- give crowds a sense of ownership of the design process and provide enthusiastic target markets;
- inspire designers to rapidly evolve design ideas and cater for multiple sub-groups;
- provide added value by providing customers with a rich visual summary of the co-design process;
- significantly reduce time-to-market and the risks of producing unwanted product.
The project will use rich internet media (e.g. ShoogleIt) data mining, crowd sourcing and the design staff and students of SBC to research this sociotechnical system.
Two key technical challenges concern: providing fast intuitive navigation of rich media, and aggregation of visual feedback to provide an at-a-glance impression of the crowd’s perceptions.
The semiotic challenge lies in gaining a greater understanding of how fixed (or polysemous) image based feedback is as a means of communication between designers and consumers. This has implications also for the use of images in visual design itself.
Research Narrative and Publications
The CDI “Head-Crowd” project is an interdisciplinary project in the Schools of Mathematics and Computer Science (MACS) and Textile and Design (TEX). The focus is on perceptual image browsing, visual communication, visual summary and interpretation of visual design feedback. The work was done by David Robb for his PhD under direction of Mike Chantler and Britta Kalkreuter as supervisors with additional supervision and work by Stefano Padilla.
Latest Publications
D. A. Robb, S. Padilla, T. S. Methven, B.Kalkreuter, M. J. Chantler. A Picture Paints a Thousand Words but Can it Paint Just One? DIS’16: Proceedings of the 2016 ACM Conference on Designing Interactive Systems. dx.doi.org/10.1145/2901790.2901791.
D. A. Robb, S. Padilla, B. Kalkreuter, M. J. Chantler Crowdsourced Feedback With Imagery Rather Than Text: Would Designers Use It? CHI’15: 33rd Annual ACM Conference on Human Factors in Computing Systems Proceedings dx.doi.org/10.1145/2702123.2702470.
D. A. Robb, S. Padilla, B. Kalkreuter, M. J. Chantler Moodsource: Enabling Perceptual and Emotional Feedback from Crowds CSCW’15: 18th ACM Conference on Computer Supported Cooperative Work & Social Computing Proceedings Companion dx.doi.org/10.1145/2685553.2702676.
Visual Crowd Communication
Moodsource: Enabling Perceptual and Emotional Feedback from Crowds

Part of the work on capturing visual feedback has involved building a perceptually relevant image browser populated with a set of abstract images. The images were screen-scraped from Flickr.com (See project acknowledgements below). Human perceptions of the relative similarity of the images were captured using techniques devised by Dr. Fraser Halley (Find his PhD thesis here).
Abstract Image Set in the SOM Browser
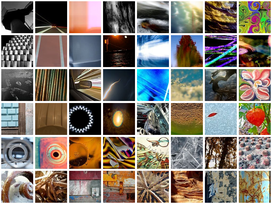
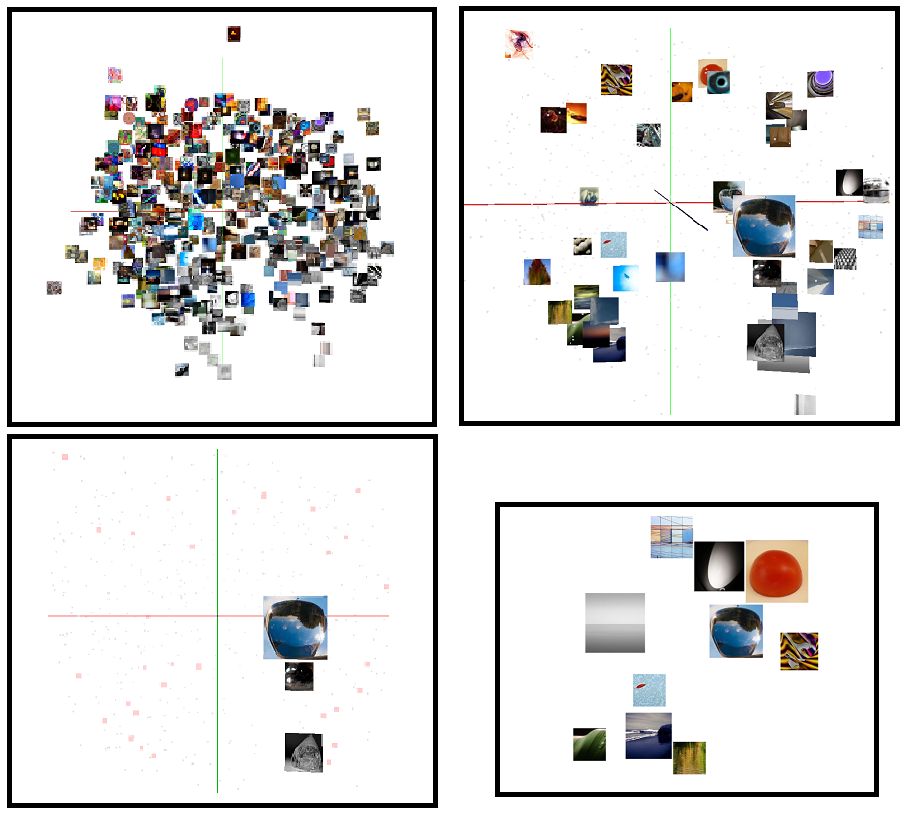
The project abstract image set can be viewed in the Self Organising Map Browser. Images judged by observers as being highly similar to each other are grouped in stacks together. Adjacent stacks contain images judged more similar to each other than stacks farther apart. Note how the observers’ similarity judgements and the SOM construction algorithm has resulted in apparently themed regions in the browser. e.g. architectural at the top right, and highly abstract, colourful at the top left. Click the thumbnail image above to try out an HTML version of the SOM browser. (In our experiment it was built it in Flash and deployed to iOS on iPads.)
Try the browser in its 7×5 stack format as used in some of the more recent experiments which used a web app interface.
The SOM browser features in the latest publications and additionally in following publications:
S. Padilla, D. Robb, F. Halley, M. J. Chantler, Browsing Abstract Art by Appearance
Predicting Perceptions: The 3rd International Conference on Appearance, 17-19 April, 2012, Edinburgh, UK. Conference Proceedings Publication ISBN: 978-1-4716-6869-2, Pages: 100-103 Download PDF
S. Padilla, F. Halley, D. Robb, M. J. Chantler, Intuitive Large Image Database Browsing using Perceptual Similarity Enriched by Crowds Computer Analysis of Images and Patterns Lecture Notes in Computer Science Volume 8048, 2013, pp 169-176 Springer Link
Abstract Image Set in a 3D MDS Visualisation
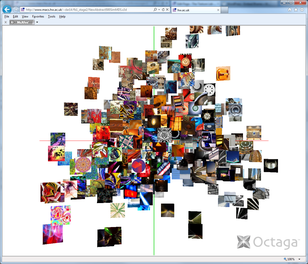
View the image set in a 3D view as a Shoogle, or as an animated GIF (8Mb)
(To view the image set still more closely you can use this x3D MDS browser. You will need to install the x3D Octaga Player plugin. Once the plugin is installed you can view it in your web browser. You will have an easier time of it if you use Internet Explorer for this. You might want to try out this very simple Hello World x3D example first, which is a much smaller download than the image set visualisation.)
The collective similarity judgements of human observers about the images can, perhaps, be better visualised in 3D “similarity” space. The closer an image is to another; the more similar those images were judged to be by observers. Conversely, the farther away two images are, the less similar they were judged to be. The similarity data was used as input to construct the SOM browser.
Perceptually Relevant Image Summaries
We developed an algorithm to generate visual summaries consisting of representative images. The algorithm uses clustering based on the image selections and the human perceptual similarity data previously gathered on the image set. (This is the same data that is used to organise the abstract image browser). The algorithm is described in the CHI’15 paper.
The image summarisation also features in the CSCW’15 extended abstract and additionally in following publications:
B. Kalkreuter and D. Robb. HeadCrowd: visual feedback for design in the Nordic Textile Journal, Special edition: Sustainability & Innovation in the Fashion Field, issue 1/2012, ISSN 1404-2487, CTF Publishing, Borås, Sweden. Pages 70-81 Download PDF
B. Kalkreuter, D. Robb, S. Padilla, M. J. Chantler Managing Creative Conversations Between Designers and Consumers Future Scan 2: Collective Voices, Association of Fashion and Textile Courses Conference Proceedings 2013, ISBN 978-1-907382-64-2, Pages 90-99 Download PDF
Communication Experiment
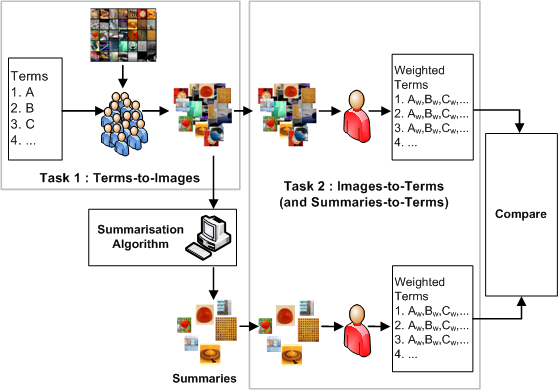
To show that communication is possible using the crowdsourced visual feedback method (CVFM) we carried out an experiment in which a group of participants were shown terms and asked to choose images from the abstract image browser to represent those terms. Summaries were made from the gathered images. The raw term image selections and the summaries were shown to another group of participants who rated the degree to which they could see the meaning of the terms in the stimuli they were shown. The term weights output by the second group of participants allowed the effectiveness of the communication and of the summarisation to be measured.
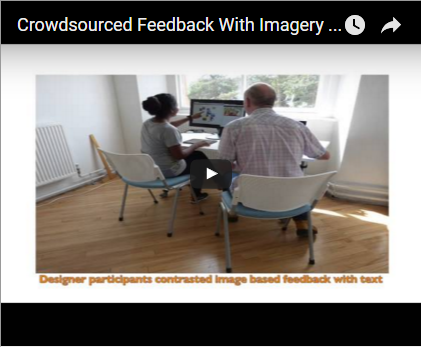
A video describes the experiment which features in the DIS’16 paper in the latest publications. The terms, the raw term image selection lists, and the algorithmically generated summaries from the experiment can be viewed using this viewer web application: The Fb Viewer (V2) is designed to be tablet (and ‘fablet’) friendly. It uses the latest jQueryMobile beta v 1.3. At the time of writing there is a slight problem with jQM v1.3 and Internet Explorer so if you are using Internet Explorer you may wish to view the desktop version.
Emotive Image Browser
To allow more figurative communication, a second browser was built. 2000 images were categorized by tagging them with terms from an emotion model. Thus every image has a normalized emotion tag frequency profile (see image above) representing the judgments of 20 paid, crowdsourced, participants.
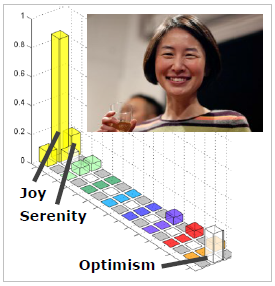
Using these profiles, the set was filtered to 204 images covering a subset of emotions suited to design conversation. The emotive images are arranged in a SOM browser defined by the emotion profiles (frequency vectors) in a similar way to the abstract browser (based on similarity vectors).
Try the emotion image browser in its 7×5 stack format as used in some of the more recent experiments which used a web app interface.
The emotion image browser features in the CHI’15 paper and the CSCW’15 extended abstract.
Evaluation
The crowdsourced visual feedback method (CVFM) was evaluated in a study with interior design students puting forward their designs for feedback and a group of student participants acting as the crowd giving feedback. The crowd were shown the designs in a random order and asked “How did the design make you feel?”. They were asked to give thier feedback in the form of abstract images, emotive images and text. In the latest publications, the CHI paper reports the designer side of the evaluation and the CSCW extended abstract reports the crowd side. Below is link to a video which accompanies the CHI paper.
Acknowledgments
Image sets:-
The project has established two databases of images for use in visual feedback. The images in the databases have been sourced from Google and Flickr and all have a Creative Commons licences. These contributors are acknowledged below.